
The Basic Structure and Functionality of the Java Virtual Machine
First published in JavaWorld, May 1996
(This article, which first appeared in JavaWorld in May 1996, was the very first technical article I ever published and contains the first Java applet I ever wrote: "EternalMath.")
Welcome to the first installment of "Under The Hood." In this column I'd like to explore topics concerning the inner workings of Java. Each month I'll focus on one area and attempt to demystify it. My aim is to help programmers understand what is actually going on when they compile and run their Java programs. In this installment, I provide an introduction to the basic structure and functionality of the Java Virtual Machine.
What is the Java Virtual Machine? Why is it here?
The Java Virtual Machine, or JVM, is an abstract computer that runs compiled Java programs. The JVM is "virtual" because it is generally implemented in software on top of a "real" hardware platform and operating system. All Java programs are compiled for the JVM. Therefore, the JVM must be implemented on a particular platform before compiled Java programs will run on that platform.
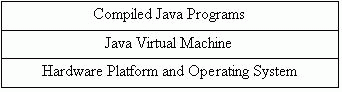
The JVM plays a central role in making Java portable. It provides a layer of abstraction between the compiled Java program and the underlying hardware platform and operating system. The JVM is central to Java's portability because compiled Java programs run on the JVM, independent of whatever may be underneath a particular JVM implementation.
What makes the JVM lean and mean? The JVM is lean because it is small when implemented in software. It was designed to be small so that it can fit in as many places as possible -- places like TV sets, cell phones, and personal computers. The JVM is mean because it of its ambition. "Ubiquity!" is its battle cry. It wants to be everywhere, and its success is indicated by the extent to which programs written in Java will run everywhere.
Java bytecodes
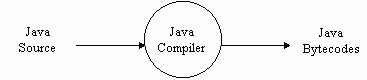
Java programs are compiled into a form called Java bytecodes. The JVM executes Java bytecodes, so Java bytecodes can be thought of as the machine language of the JVM. The Java compiler reads Java language source (.java) files, translates the source into Java bytecodes, and places the bytecodes into class (.class) files. The compiler generates one class file per class in the source.
To the JVM, a stream of bytecodes is a sequence of instructions. Each instruction consists of a one-byte opcode and zero or more operands. The opcode tells the JVM what action to take. If the JVM requires more information to perform the action than just the opcode, the required information immediately follows the opcode as operands.
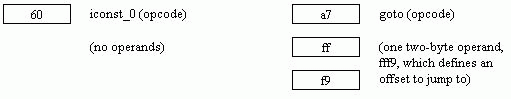
A mnemonic is defined for each bytecode instruction. The mnemonics can be thought of as an assembly language for the JVM. For example, there is an instruction that will cause the JVM to push a zero onto the stack. The mnemonic for this instruction is iconst_0, and its bytecode value is 60 hex. This instruction takes no operands. Another instruction causes program execution to unconditionally jump forward or backward in memory. This instruction requires one operand, a 16-bit signed offset from the current memory location. By adding the offset to the current memory location, the JVM can determine the memory location to jump to. The mnemonic for this instruction is goto, and its bytecode value is a7 hex.
Virtual parts
The "virtual hardware" of the Java Virtual Machine can be divided into four basic parts: the registers, the stack, the garbage-collected heap, and the method area. These parts are abstract, just like the machine they compose, but they must exist in some form in every JVM implementation.
The minimum size of a word in the JVM is 32 bits. Each register in the JVM stores one word. The stack, the garbage-collected heap, and the method area reside somewhere within the JVM's addressable memory. The exact location of these memory areas is a decision of the implementor of each particular JVM.
A word in the Java Virtual Machine is 32 bits. The JVM has a small number of primitive data types: byte (8 bits), short (16 bits), int (32 bits), long (64 bits), float (32 bits), double (64 bits), and char (16 bits). With the exception of char, which is an unsigned Unicode character, all the numeric types are signed. These types conveniently map to the types available to the Java programmer. One other primitive type is the object handle, which is a 32-bit address that refers to an object on the heap.
The method area, because it contains bytecodes, is aligned on byte boundaries. The stack and garbage-collected heap are aligned on word (32-bit) boundaries.
The proud, the few, the registers
The JVM has a program counter and three registers that manage the stack. It has few registers because the bytecode instructions of the JVM operate primarily on the stack. This stack-oriented design helps keep the JVM's instruction set and implementation small.
The JVM uses the program counter, or pc register, to keep track of where in memory it should be executing instructions. The other three registers -- optop register, frame register, and vars register -- point to various parts of the stack frame of the currently executing method. The stack frame of an executing method holds the state (local variables, intermediate results of calculations, etc.) for a particular invocation of the method.
The method area and the program counter
The method area is where the bytecodes reside. The program counter always points to (contains the address of) some byte in the method area. The program counter is used to keep track of the thread of execution. After a bytecode instruction has been executed, the program counter will contain the address of the next instruction to execute. After execution of an instruction, the JVM sets the program counter to the address of the instruction that immediately follows the previous one, unless the previous one specifically demanded a jump.
The Java stack and related registers
The Java stack is used to store parameters for and results of bytecode instructions, to pass parameters to and return values from methods, and to keep the state of each method invocation. The state of a method invocation is called its stack frame. The vars, frame, and optop registers point to different parts of the current stack frame.
There are three sections in a Java stack frame: the local variables, the execution environment, and the operand stack. The local variables section contains all the local variables being used by the current method invocation. It is pointed to by the vars register. The execution environment section is used to maintain the operations of the stack itself. It is pointed to by the frame register. The operand stack is used as a work space by bytecode instructions. It is here that the parameters for bytecode instructions are placed, and results of bytecode instructions are found. The top of the operand stack is pointed to by the optop register.
The execution environment is usually sandwiched between the local variables and the operand stack. The operand stack of the currently executing method is always the topmost stack section, and the optop register therefore always points to the top of the entire Java stack.
The garbage-collected heap
The heap is where the objects of a Java program live. Any time you allocate memory with the new operator, that memory comes from the heap. The Java language doesn't allow you to free allocated memory directly. Instead, the runtime environment keeps track of the references to each object on the heap, and automatically frees the memory occupied by objects that are no longer referenced -- a process called garbage collection.
Eternal math: a JVM simulation
The applet below simulates a JVM executing a few bytecode instructions. The instructions in the simulation were generated by the javac compiler given the following java code:
class Act {
    public static void doMathForever() {
        int i = 0;
        while (true) {
            i += 1;
            i *= 2;
        }
    }
}
The instructions in the simulation represent the body of the doMathForever() method. These instructions were chosen because they are a short sequence of bytecodes that do something mildly interesting on the stack. This simulation stars the registers, the stack, and the method area. The heap is not involved in this bytecode sequence, so it is not shown as part of the applet's user interface. All numbers in the simulation are shown in hex.
As our story opens, the program counter (pc register) is pointing to an iconst_0 instruction. The iconst_0 instruction is in the method area, where bytecodes like to hang out.
When you press the Step button, the JVM will execute the single instruction that is being pointed to by the program counter. So, the first time you press the Step button, the iconst_0 instruction, which pushes a zero onto the stack, will be executed. After this instruction has executed,the program counter will be pointing to the next instruction to execute.Subsequent presses of the Step button will execute subsequent instructions and the program counter will lead the way. Pressing the Reset button will cause the simulation to start over at the beginning.
The value of each register is shown two ways. The contents of each register, a 32-bit address, is shown in hex across the top of the simulation. Additionally, I put a small pointer to the address contained in each register next to the address in either the stack or the method area. The address contained by the program counter, for example, has a pc> next to it in the method area.
The Java stack is word-based. Each time something is pushed onto the Java stack, it goes on as a word (although longs and doubles actually go on as two words). In the simulation, the Java stack is shown as an upside-down tower of words. It is shown growing down the panel (up in memory addresses) as words are pushed onto it. The stack recedes back up the panel as words are popped from it. In this implementation of the JVM, the optop register always points to the next available slot on the Java stack.
All three sections of the stack frame for the currently executing method-- the local variables, the execution environment, and the operand stack -- are shown in the simulation. Only the local variables and operand stack take part in this simulation, though. The execution environment isn't involved in this particular bytecode sequence, so it is shown filled with zeros.
The local variables section of the Java stack is treated as an array of words starting at the location pointed to by the vars register. Bytecodes that deal with local variables generally include an array index, which is an offset from the vars register. The address of the nth local variable is (vars + (n * 4)). You must multiply n by 4, because each word is 4 bytes long.
The doMathForever() method has only one local variable, i. It is therefore at array position zero and is pointed to directly by the vars register. For example, the iinc instruction takes two byte-sized operands, a local variable index and an amount. In the simulation, "iinc 0 1" increments by one the integer at local variable array position zero. This instruction implements the "i += 1;" statement from doMathForever().
With enough patience and clicks of the Step button, you can get an arithmetic overflow. When the JVM encounters such a condition, it just truncates, as is shown by this simulation. No exceptions are thrown. (Actually, I am just displaying the result of a multiply operation performed by the "real" JVM in your browser.)
I put a text description of each step at the bottom of the applet, which I hope will help to carry you through the simulation with clarity and deep understanding. Happy clicking.
Click here for the source code.
- "The Java Virtual Machine Specification," the official word from Sun.
http://java.sun.com/1.0alpha3/doc/vmspec/vmspec_1.html - When it comes out, the book The Java Virtual Machine Specification (http://www.aw.com/cp/lindholm-yellin.html), by Tim Lindholm and Frank Yellin (ISBN 0-201-63452-X), part of The Java Series (http://www.aw.com/cp/javaseries.html), from Addison-Wesley, will likely be the best JVM resource.
This article was first published under the name Under the Hood: The Lean, Mean Virtual Machine in JavaWorld, a division of Web Publishing, Inc., May 1996.
Talk back!
Have an opinion? Be the first to post a comment about this article.
About the author
-
Artima provides consulting and training services to help you make the most of Scala, reactive
and functional programming, enterprise systems, big data, and testing.
2070 N Broadway Unit 305
Walnut Creek CA 94597
USA
(925) 918-1769 (Phone)