
Two years ago, Ruby had no cross-platform libraries to create PDF documents. There were three C library bindings written to work with existing libraries, but these worked best in Unix environments, not Windows environments. Noritsugu Nakimura had written bindings[0] to ClibPDF[1] and Panda PDF[2] in 2001; the interfaces never left “alpha” status. TAKAHASHI Hitoshi released bindings[3] to PDFlib[4] in 2002, but PDFlib is commercially licensed software, which makes it inappropriate for a wide variety of projects.
Around the same time, I had need of a PDF document generator to tie in with some Ruby code I was working for a consulting job. I looked around and found the free PHP library “cPDF” by R & OS[5] of New Zealand. With some effort, I ported an initial pass to Ruby and released it as a technology preview in September 2003 (ruby-talk:82246)[6]. My needs passed, but I continued to plan an upgrade to PDF::Writer, but was distracted with other projects for some time. Earlier this year, I started reworking the API to PDF::Writer and by June, I had something that I was happy with and released it as version 1.0. As of this writing, the current version is PDF::Writer 1.1.3[7].
One of the things that sets PDF::Writer apart from most other projects is the amount of documentation provided. As of the latest version, the manual—which is itself generated with PDF::Writer—is ninety-five pages and covers not only the various aspects of PDF::Writer, but its prerequisite libraries (Transaction::Simple[8] and color-tools[9]). This article is intended to provide an even briefer introduction to the most interesting aspects of PDF::Writer, introduce a couple of techniques that are as of yet not (fully) documented, and provide a brief insight into the future of this vibrant project. This article does not provide an introduction to Ruby itself.
Getting Started
The first step in using PDF::Writer is to install it. The preferred way to do this is with RubyGems, as this will drag in the prerequisite libraries. If, instead, you choose to install PDF::Writer from the .tar.gz archives, you will also need to install the latest versions of Transaction::Simple and color-tools.
There are two well-known problems with installing and using PDF::Writer. The first is for users of PDF::Writer on Mac OS X 10.4 (“Tiger”). If you are using this version of PDF::Writer, the Ruby initially included was compiled with the wrong endianness and is unable to read images properly. This can be fixed by building Ruby yourself or finding someone who has compiled it properly and installing that version.
The second is for users of the PDF::Writer RubyGem. Before you can use PDF::Writer, you must load the RubyGems library. The easiest way to do this is by setting the RUBYOPT environment variable to include rubygems. The most reliable way to do this is to require 'rubygems' at the head of your scripts. When running the demo programs (available as a separate download for RubyGems users), remember to run them with ruby -rubygems demo-name.
The simplest possible program to write with PDF::Writer is, of course, a “hello, world”-type of program.
      require "pdf/writer"

      pdf = PDF::Writer.new
      pdf.select_font "Times-Roman"
      pdf.text "Hello, Ruby.", :font_size => 72, :justification => :center
      pdf.save_as("hello.pdf")
After requiring PDF::Writer, a document is created with the default options and the “Times-Roman” default font is selected. The text “Hello, Ruby.” is added to the document at 72 points in the centre of the line. This document is then saved as “hello.pdf”. It doesn’t get much simpler. The text method handles any text wrapping or pagination that needs to be done because the text will not fit on the displayed page.
Taking hello.rb to the Web
While it’s certainly useful to be able to write PDF documents directly to disk, more useful for many developers is the ability to send a generated PDF across the network. The changes to make this work aren’t large:
      #!/usr/bin/ruby
      require "pdf/writer"
      require "cgi"

      cgi = CGI.new
      pdf = PDF::Writer.new
      pdf.select_font "Times-Roman"
      pdf.text "Hello, Ruby.", :font_size => 72, :justification => :center

      str = pdf.render

      puts <<-EOS
      Content-Type: application/pdf
      Size: #{str.size}

      EOS

      puts str
In Ruby on Rails[10] it’s not much different. If you want a new action on your controller (say, “/pdf”), you add a “pdf” method to your controller and fill it in like so:
      require "pdf/writer"

      class HelloController < ApplicationController
        # ...
        def pdf
          _pdf = PDF::Writer.new
          _pdf.select_font "Times-Roman"
          _pdf.text "Hello, Ruby.", :font_size => 72, :justification => :center

          send_data _pdf.render, :filename => "hello.pdf",
                    :type => "application/pdf"
        end
        # ...
      end
More Text
The PDF::Writer#text method takes care of all text wrapping for you, the writer. That means that if your text will not fit on a single line, then it will be wrapped. If your text will not fit on a single page, then a new page will automatically be created. The layout engine in PDF::Writer is extensive and somewhat extensible. By no means is it capable of replacing a professional layout program (or even a simple word processor), but it is very good at what it does. Sometimes, however, it is necessary for the author of a document generation program to indicate precisely where text should go.
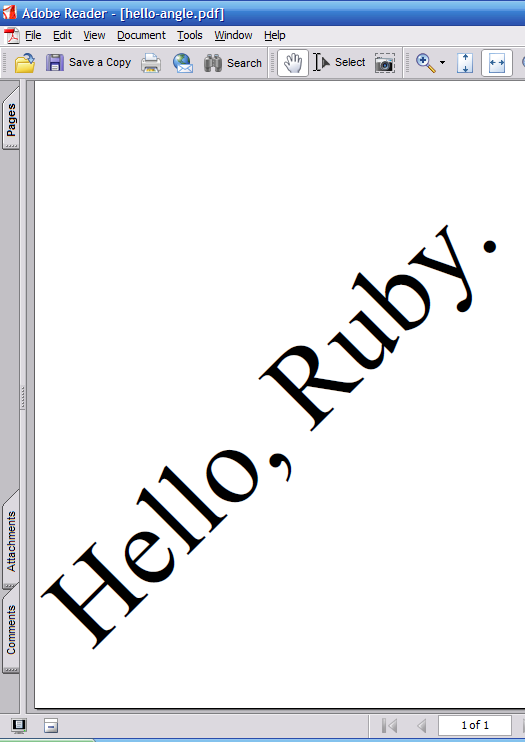
This is when PDF::Writer#add_text and PDF::Writer#add_text_wrap are useful. The former will take a string and place it starting at specific (x, y) coordinates. If the text exceeds the size of the page, it will not stop. The latter also accepts a text width and writes only as much text from the original string as will fit in the specified width. The portion of the text that does not fit will be returned. Both of these methods also accept a font size (by default, the current PDF::Writer#font_size will be used) and a text angle. The following code puts our “Hello, Ruby” text in a different location on the page and at an angle.
      require "pdf/writer"

      pdf = PDF::Writer.new
      pdf.select_font "Times-Roman"
      x = pdf.absolute_left_margin
      y = pdf.absolute_bottom_margin
      pdf.add_text(x, y, "Hello, Ruby.", 72, 45)
      pdf.save_as("hello-angle.pdf")
A Brief Explanation of PDF Units and Coordinate Spaces
Measurements in PDF documents are by default in points (about 1/72”, or 1/3mm). The coordinate space can be rotated, scaled, and translated, so all measurements are in “userspace units”. The origin coordinate, (0, 0) in PDF is not at the upper left-hand corner, but instead is in the lower left-hand corner of the page. The PDF::Writer text layout engine assumes the default coordinate space size and orientation.
All angular measurements in PDF::Writer (for both text and graphics) are counter-clockwise. The following table shows the approximate degree measurement of hours on a twelve-hour clock face.
| Hour | Angle |
|---|---|
| 1 | 60° |
| 2 | 30° |
| 3 | 0° |
| 4 | 330° |
| 5 | 300° |
| 6 | 270° |
| 7 | 240° |
| 8 | 210° |
| 9 | 180° |
| 10 | 150° |
| 11 | 120° |
| 12 | 90° |
More Than Text
Text documents are useful, but sometimes, as the cliché says, “a picture is worth a thousand words.” PDF fundamentally supports both “sampled” (that is, bitmapped) and drawn vector graphics. PDF::Writer exposes this functionality to the Ruby developer.
Inserting Images
PDF::Writer only supports the insertion of JPEG and PNG format images, and there is limited support for some of the PNG format’s features. Other formats can be supported by conversion, possibly through RMagick[11] Images may either be placed at specific points on the page canvas (with PDF::Writer::Graphics#add_image and PDF::Writer::Graphics#add_image_from_file) or flowed onto the page relative to the vertical text writing pointer with PDF::Writer::Graphics#image.
Images are inserted using one pixel per PDF unit. This means that images are generally inserted with 72 DPI (dots per inch)[12] and must be scaled for higher quality printing images. With #add_image and #add_image_from_file this means specifying an image display size; #image allows for relative scaling. The following table shows what an image of 320×240 pixels would need to be at various DPI resolutions and the corresponding approximate physical image size. Most computer displays are 72 or 96 DPI; “photo-quality” printed images are usually 300 DPI or better.
| DPI | Scale | Pixel Size | Physical Size |
|---|---|---|---|
| 72 | 100% (1.0) | 320×240 | 41/2”×31/4” (113mm × 85mm) |
| 96 | 75% (0.75) | 240×180 | 31/3”×21/2” (85mm × 631/2mm) |
| 300 | 24% (0.24) | 77×58 | 1”×0.8” (27mm × 201/2mm) |
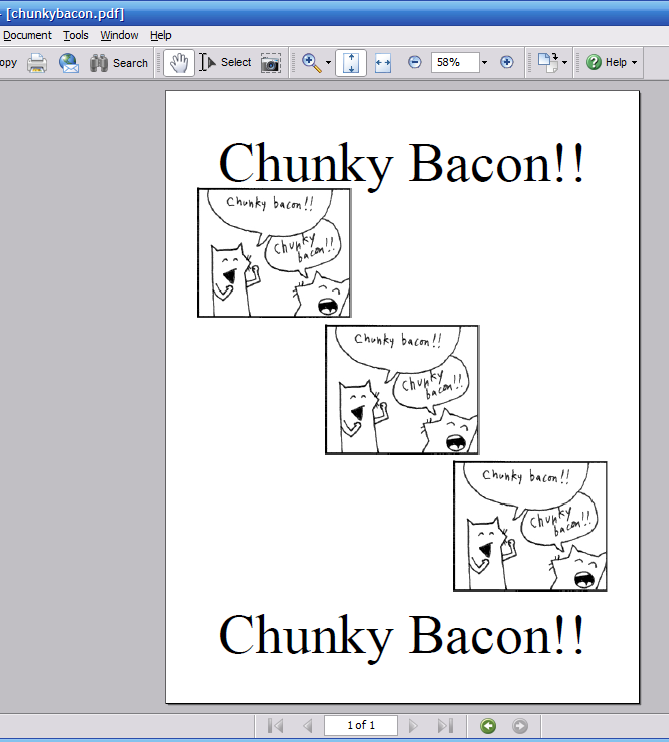
This demo uses the automatic positioning of #image to insert similar images. Notice that all three image methods return the image object that was added to the document so that it can be reused (as it is in the third case). In all three inserts, the images will be scaled to 75% of their native size, treating them as 96 DPI.
      # This code is demo/chunkybacon.rb
      require "pdf/writer"

      pdf = PDF::Writer.new
      pdf.select_font "Times-Roman"
      pdf.text "Chunky Bacon!!", :font_size => 72, :justification => :center

      # PDF::Writer#image returns the image object that was added.
      i0 = pdf.image "../images/chunkybacon.jpg", :resize => 0.75
      pdf.image "../images/chunkybacon.png", :justification => :center, :resize => 0.75

      # It can reinsert an image if wanted.
      pdf.image i0, :justification => :right, :resize => 0.75

      pdf.text "Chunky Bacon!!", :font_size => 72, :justification => :center

      pdf.save_as("chunkybacon.pdf")
Drawing Pictures
PDF documents permit the drawing of images with vector graphics primitives. PDF::Writer supports these primitives and adds a few more complex shapes of its own. Vector graphics are based on tracing paths and either drawing the lines along those paths (called “stroking” in PDF) or filling between the paths, as opposed to “sampled” (bitmapped) images—SVG as opposed to PNG.
PDF::Writer does not yet support SVG (Scalable Vector Graphics)[13] or EPS (Encapsulated PostScript®)[14] document insertion natively, but in time there will be a native API for inserting an SVG image document similar to those provided for bitmapped images. EPS support should be possible not long after.
The comparison with SVG is apt, as there are clear differences between the two drawing formats. With SVG, when a line draw command is given, a visible line is drawn between the two points. With PDF, an invisible path is drawn. The path is not made visible until it is either stroked or filled. There is a further distinction to how paths work, but curved paths are supported in PDF documents with cubic Bézier curves[15]; SVG supports both cubic and quadratic Bézier curves.
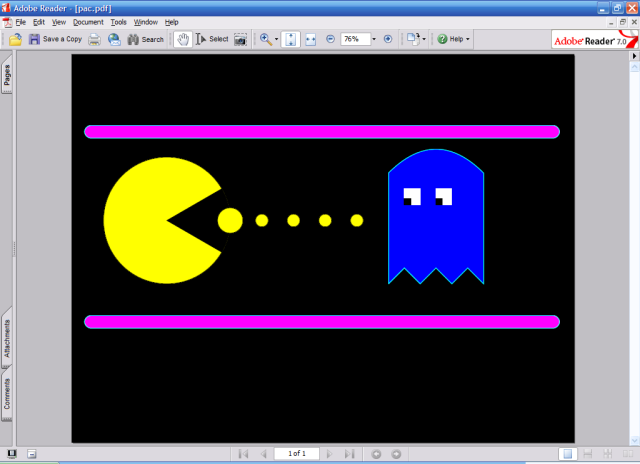
PDF::Writer offers the basic primitives (#move_to, #line_to, #curve_to and variants, #rectangle, and #close) and more complex shapes that draw complete paths (#line, #curve and variants, #circle_at, #ellipse_at, #ellipse2_at, #segment_at, #polygon, #rounded_rectangle, and #star). These drawn paths may be stroked or filled with #stroke and #fill and variants. The following demonstrates many of these drawing operations:
      # This is a modified version of demo/pac.rb.
      require 'pdf/writer'
      pdf = PDF::Writer.new(:orientation =< :landscape)

      pdf.fill_color    Color::RGB::Black
      pdf.rectangle(0, 0, pdf.page_width, pdf.page_height).fill

      # Wall
      pdf.fill_color    Color::RGB::Magenta
      pdf.stroke_color  Color::RGB::Cyan
      pdf.rounded_rectangle(20, 500, 750, 20, 10).close_fill_stroke
      pdf.rounded_rectangle(20, 200, 750, 20, 10).close_fill_stroke

      # Body
      pdf.fill_color    Color::RGB::Yellow
      pdf.stroke_color  Color::RGB::Black
      pdf.circle_at(150, 350, 100).fill_stroke

      # Mouth
      pdf.fill_color    Color::RGB::Black
      pdf.segment_at(150, 350, 100, 100, 30, -30).close_fill_stroke

      # Dot
      pdf.fill_color    Color::RGB::Yellow
      pdf.circle_at(250, 350, 20).fill_stroke
      pdf.circle_at(300, 350, 10).fill_stroke
      pdf.circle_at(350, 350, 10).fill_stroke
      pdf.circle_at(400, 350, 10).fill_stroke
      pdf.circle_at(450, 350, 10).fill_stroke

      # Ghost
      pdf.fill_color    Color::RGB::Blue
      pdf.stroke_color  Color::RGB::Cyan
      pdf.move_to(500, 250).line_to(500, 425).
          curve_to(550, 475, 600, 475, 650, 425).line_to(650, 250).
          line_to(625, 275).line_to(600, 250).line_to(575, 275).
          line_to(550, 250).line_to(525, 275).line_to(500, 250).
          fill_stroke

      # Ghost Eyes
      pdf.fill_color    Color::RGB::White
      pdf.rectangle(525, 375, 25, 25).fill
      pdf.rectangle(575, 375, 25, 25).fill

      pdf.fill_color    Color::RGB::Black
      pdf.rectangle(525, 375, 10, 10).fill
      pdf.rectangle(575, 375, 10, 10).fill

      pdf.save_as("pac.pdf")
Charts and Tables
PDF::Writer supports charts and tables, too. As of this writing, only one chart type (a standard deviation) is supported, but others will be added over time.
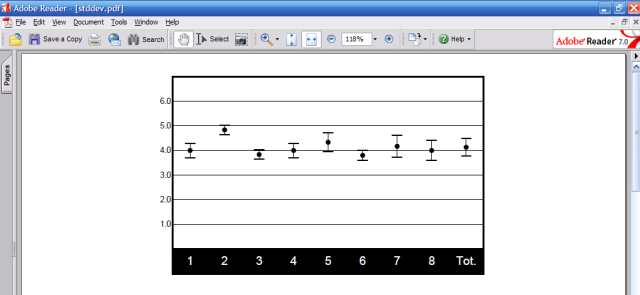
Standard Deviation Chart
This chart type shows the average value of a series of data and the standard deviations from those values. The average value is plotted as a point on a scale; the standard deviation values will be plotted as bars above and below that point. This is a fixed-height, variable-width chart that will wrap to a second chart if there more columns than can be displayed.
      require 'pdf/writer'
      require 'pdf/charts/stddev'

      pdf = PDF::Writer.new
      PDF::Charts::StdDev.new do |chart|
      chart.data <<
        PDF::Charts::StdDev::DataPoint.new(1,      4.0000, 0.5774) <<
        PDF::Charts::StdDev::DataPoint.new(2,      4.8333, 0.3727) <<
        PDF::Charts::StdDev::DataPoint.new(3,      3.8333, 0.3727) <<
        PDF::Charts::StdDev::DataPoint.new(4,      4.0000, 0.5774) <<
        PDF::Charts::StdDev::DataPoint.new(5,      4.3333, 0.7454) <<
        PDF::Charts::StdDev::DataPoint.new(6,      3.8000, 0.4000) <<
        PDF::Charts::StdDev::DataPoint.new(7,      4.1667, 0.8975) <<
        PDF::Charts::StdDev::DataPoint.new(8,      4.0000, 0.8165) <<
        PDF::Charts::StdDev::DataPoint.new("Tot.", 4.1277, 0.7031)

      chart.scale.show_labels = true

      chart.render_on pdf
      end
      pdf.save_as('stddev.pdf')
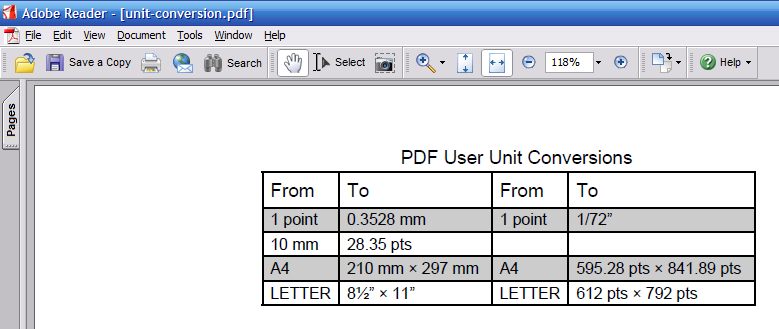
Tables
Tables in PDF::Writer are achieved with the PDF::SimpleTable class, so called because it has a relatively simple table model with more constraints on how the table can be rendered than the table model in HTML or XHTML. The table model itself is simple, but there are a number of configuration options that affect the display of the table. The following code demonstrates part of what is possible with PDF::SimpleTable.
      require 'pdf/writer'
      require 'pdf/simpletable'

      pdf = PDF::Writer.new
      pdf.select_font("Helvetica")

      PDF::SimpleTable.new do |tab|
        tab.title = "PDF User Unit Conversions"
        tab.column_order.push(*%w(from1 to1 from2 to2))

        tab.columns["from1"] = PDF::SimpleTable::Column.new("from1") { |col|
          col.heading = "From"
        }
        tab.columns["to1"] = PDF::SimpleTable::Column.new("to1") { |col|
          col.heading = "To"
        }
        tab.columns["from2"] = PDF::SimpleTable::Column.new("from2") { |col|
          col.heading = "From"
        }
        tab.columns["to2"] = PDF::SimpleTable::Column.new("to2") { |col|
          col.heading = "To"
        }

        tab.show_lines    = :all
        tab.show_headings = true
        tab.orientation   = :center
        tab.position      = :center

        data = [
          { "from1" =< "1 point", "to1" =< "0.3528 mm",
            "from2" =< "1 point", "to2" =< "1/72”" },
          { "from1" =< "10 mm", "to1" =< "28.35 pts",
            "from2" =< "", "to2" =< "" },
          { "from1" =< "A4", "to1" =< "210 mm × 297 mm",
            "from2" =< "A4", "to2" =< "595.28 pts × 841.89 pts" },
          { "from1" =< "LETTER", "to1" =< "81/2” × 11”",
            "from2" =< "LETTER", "to2" =< "612 pts × 792 pts" },
          ]

        tab.data.replace data
        tab.render_on(pdf)
      end
      pdf.save_as('unit-conversion.pdf')
Partial Document Generation Technique
One of the limitations of PDF::Writer (that the documents may never become singleton objects or hold references to Proc objects) also provides a strength for document generation. This limitation means that a document may be saved with Marshal::dump at any point during the generation process and it may then be restarted with the pregenerated code in that program or a separate program entirely. PDF::TechBook uses a variant of this to cache the manual so that all that needs to be done is page numbering and table of contents generation.
This technique could be used to generate a partial document that contains a letterhead or logo, like below:
      # letterhead.rb
      require 'pdf/writer'
      pdf = PDF::Writer.new

      pdf.text "Using PDF::Writer"
      pdf.line(pdf.absolute_left_margin, pdf.y + 10,
      pdf.absolute_right_margin, pdf.y + 10).stroke
      pdf.top_margin = pdf.y + 20

      File.open("letterhead._pc", "wb") { |f| f.write Marshal.dump(pdf) }
Then, at a later date, this pregenerated letter head can be loaded—even by multiple processes at the same time—and added to:
      require "pdf/writer"

      class HelloController < ApplicationController
        # ...
        def pdf
          _pdf = File.open("letterhead._pc", "rb") { |f|
            Marshal.load(f.read)
          }

          _pdf.text "Hello, Ruby.", :font_size => 72, :justification => :center

          send_data _pdf.render, :filename => "hello.pdf",
                    :type => "application/pdf"
        end
        # ...
      end
Conclusion
PDF::Writer is a powerful and useful library that can be used in most situations requiring formatted output. While its layout engine isn’t as powerful as a word processor’s, it is sufficient for most purposes. Being pure Ruby, it isn’t as fast as other solutions, either, but it is certainly fast enough. There are techniques that one can use, too, such as the partial document generation technique, to amortize the cost of generating complex documents. Development on PDF::Writer is active, and I am receptive of any bug fixes, enhancements, or extensions you wish to offer.
Resources
[0] Bindings for ClibPDF
http://www2s.biglobe.ne.jp/~Nori/ruby/
[1] ClibPDF
http://www.fastio.com/
[2] Panda PDF
https://savannah.nongnu.org/projects/panda/
[3] Bindings to PDFlib
http://www-ps.kek.jp/thitoshi/ruby/pdflib/index.html
[4] PDFlib
http://www.pdflib.com/
[5] PHP Library “cPDF” by R & OS
http://ros.co.nz/pdf/
[6] PDF::Writer Preview
http://www.ruby-talk.org/cgi-bin/scat.rb/ruby/ruby-talk/82246
[7] PDF::Writer 1.1.3
http://rubyforge.org/frs/?group_id=81
[8] Transaction::Simple
http://rubyforge.org/projects/trans-simple/
[9] Color-tools
http://ruby-pdf.rubyforge.org/color-tools/
[10] Ruby on Rails
http://rubyonrails.org/
[11] RMagick
http://rmagick.rubyforge.org/
[12] Why 72 DPI?
http://www.wildpicture.com/pages/photography/dpi.htm
[13] Scalable Vector Graphics
http://www.w3c.org/Graphics/SVG
[14] Encapsulated PostScript
http:////www.cs.indiana.edu/docproject/programming/postscript/eps.html
[15] Bézier Curves
http://astronomy.swin.edu.au/~pbourke/curves/bezier/
Talk back!
Have an opinion? Readers have already posted 23 comments about this article. Why not add yours?
About the author
Ara Howard is Research Associate for the The Cooperative Institute for Research in Environmental Sciences (CIRES). He spends his time programming Ruby, or mountain biking and skiing with his wife Jennifer and trio of border collies : Eli, Joey, and Zipper.
Artima provides consulting and training services to help you make the most of Scala, reactive
and functional programming, enterprise systems, big data, and testing.
2070 N Broadway Unit 305
Walnut Creek CA 94597
USA
(925) 918-1769 (Phone)